Optimizing Code & CPU architecture understanding
Optimizing code is required when we identify that code is running slower then expected time and hence we need improve its performance. But before that we need to have an actual understanding of Memory and how CPU utilizes it.
Mental model of a memory
In order to optimize code we need to have mental model of memory.
High Level View
At the highest level you have a CPU’s core memory which directly accesses a L1 cache. The L1 cache has the fastest access, so things which will be needed soon are kept there. However, it is filled from the L2 cache, which itself is filled from the L3 cache, which is filled from the main memory. This bring us to the first idea in optimizing code: using things that are already in a closer cache can help the code run faster because it doesn’t have to be queried for and moved up this chain.
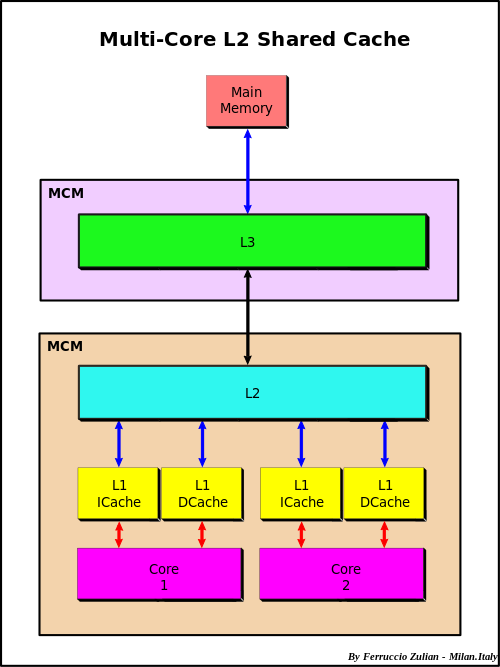
When something needs to be pulled directly from main memory this is known as a cache miss. To understand the cost of a cache miss vs standard calculations, take a look at this classic chart.
Cache Lines and Row/Column-Major
Many algorithms in numerical linear algebra are designed to minimize cache misses. Because of this chain, many modern CPUs try to guess what you will want next in your cache. When dealing with arrays, it will speculate ahead and grab what is known as a cache line: the next chunk in the array. Thus, your algorithms will be faster if you iterate along the values that it is grabbing.
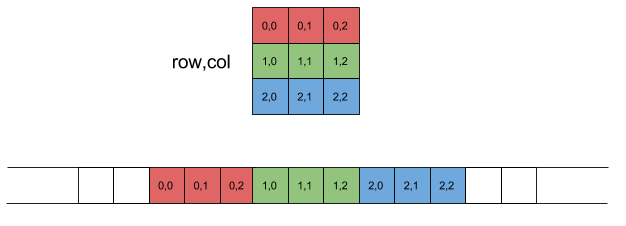
The values that it grabs are the next values in the contiguous order of the stored array. There are two common conventions: row major and column major. Row major means that the linear array of memory is formed by stacking the rows one after another, while column major puts the column vectors one after another.
- Column major
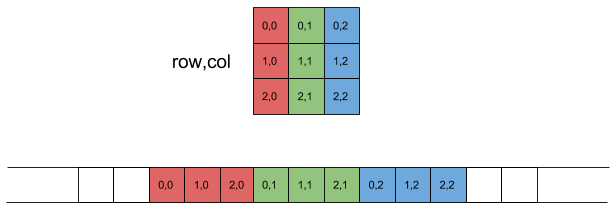
Julia, FORTRAN and MATLAB are column major but Numpy is row major
- Row major
Stack & Heap Memory
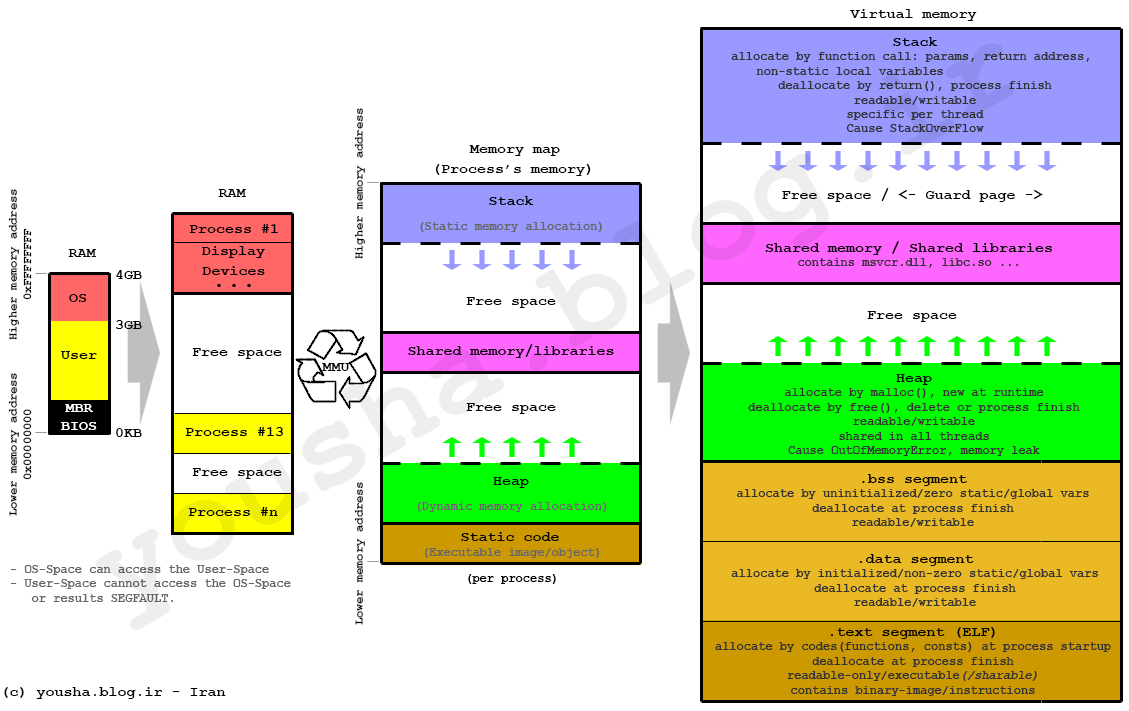
Stack:
-
Stack require static allocation
-
It requires to know the variable type and size at compile time
-
Variable can be accessed instantaneously because data is stored in ordered fashion(LIFO : Last In First Out)
-
Time-complexity for accessing data in Stack memory is O(1)
-
Since Stack memory is limited we need to use Heap memory

Heap:
- Heap is essentially stack of pointers to objects in memory
- When Heap variables are needed their values are pulled up in cache chain

Heap Allocations and Speed
Because Stack memory is limited we store large-data in Heap memory.
and accessing heap memory is slower due to pointer indirection.
- Question: Why large arrays are allocated heap memory?
- Answer: Because we don’t know at compile what will be size of the array and hence they are allocated heap memory
- Question: How can we write code which will enable us to efficiently access data from heap memory?
- Answer: There are following few ways we can improve heap allocation:
- Mutation
- Broadcasting
- Vectorization
First question comes to mind why python for-loop is so slow compare to C or C++?
Because of the dynamically typed nature of python. Python first goes line-by-line through the code, compiles the code into bytecode, which is then executed to run the program.
Due to the dynamic nature of python it has no idea about the type of variable so in each iteration during runtime it has to perform the bunch of checks like determining type of variable, resolving its scope , checking for any invalid operations.
Mutation
Many times you do need to write into an array, so how can you write into an array without performing a heap allocation?
The answer is mutation. Mutation is changing the values of an already existing array. In that case, no free memory has to be found to put the array (and no memory has to be freed by the garbage collector).
# explicity array
def normalize(array: np.ndarray) -> np.ndarray:
    """
    Takes a floating point array.
    Returns a normalized array with values between 0 and 1.
    """
    low = array.min()
    high = array.max()
    return (array - low) / (high - low)
# Memory foot print of above function `3*A` bytes of RAM

## In-place modification (example of mutation)
def normalize_in_place(array: np.ndarray):
    low = array.min()
    high = array.max()
    array -= low
    array /= high - low

# memory footprint will be A bytes compare to 3*A bytes
# aka hidden mutation
def normalize(array: np.ndarray) -> np.ndarray:
    low = array.min()
    high = array.max()
    result = array.copy()
    result -= low
    result /= high - low
    return result

# memory footprint will be 2*A bytes compare to 3*A bytes
Example Application :
- Many NumPy APIs include an
outkeyword argument, allowing you to write the results to an existing array, often including the original one. - Pandas operations usually have an
inplacekeyword argument that modifies the object instead of returning a new one.
Vectorization
Question: What is vectorization and example to understand how it can improve performance?
Now we know because of For loop and type checking the code is slowing down in python. So that’s why optimized pre-compiled C or C++ code is written under the hood of numpy to get maximum speed.
Numpy allows arrays to have only single data-type which helps in getting rid of type-checking issue compare to python.
Let’s take an example:
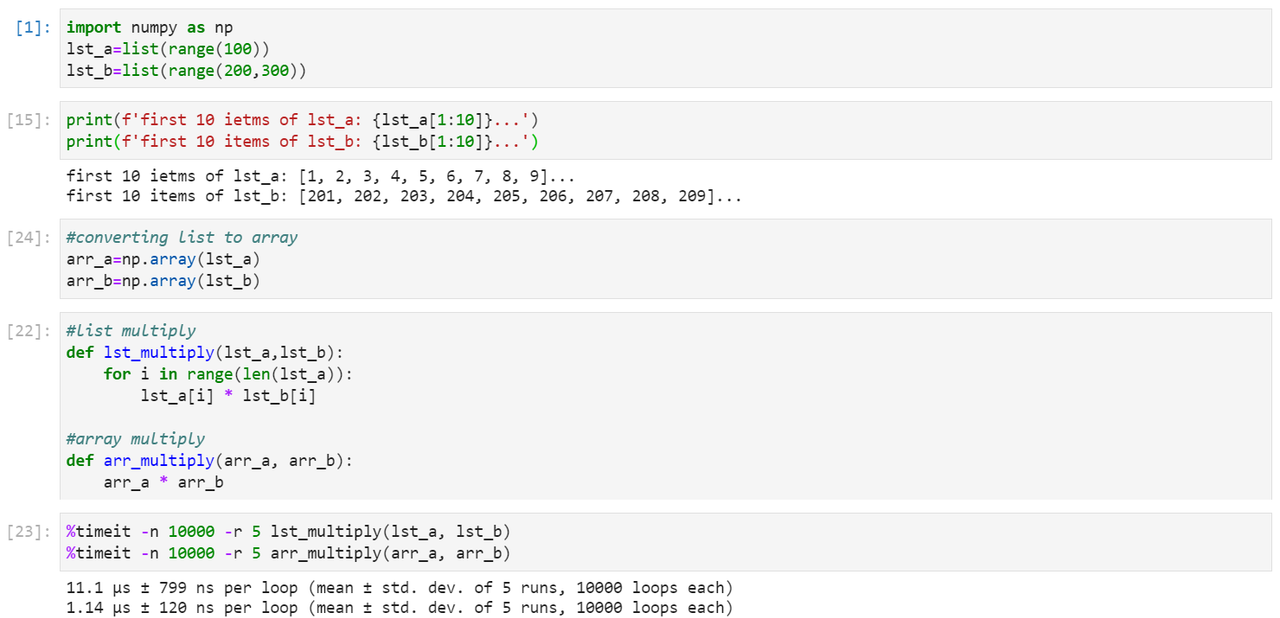
Question: How does this happen?
This is because internally, NumPy delegates the loop to pre-compiled, optimized C code under the hood. This process is called vectorization of the multiplication operator.
Technically, the term vectorization of a function means that the function is now applied simultaneously over many values instead of a single value, which is how it looks from the python code ( Loops are nonetheless executed but in C)
Let’s take one more example from vector and matrix multiplication. We all know how Regression works and below is equation for the same

Let’s implement same in python
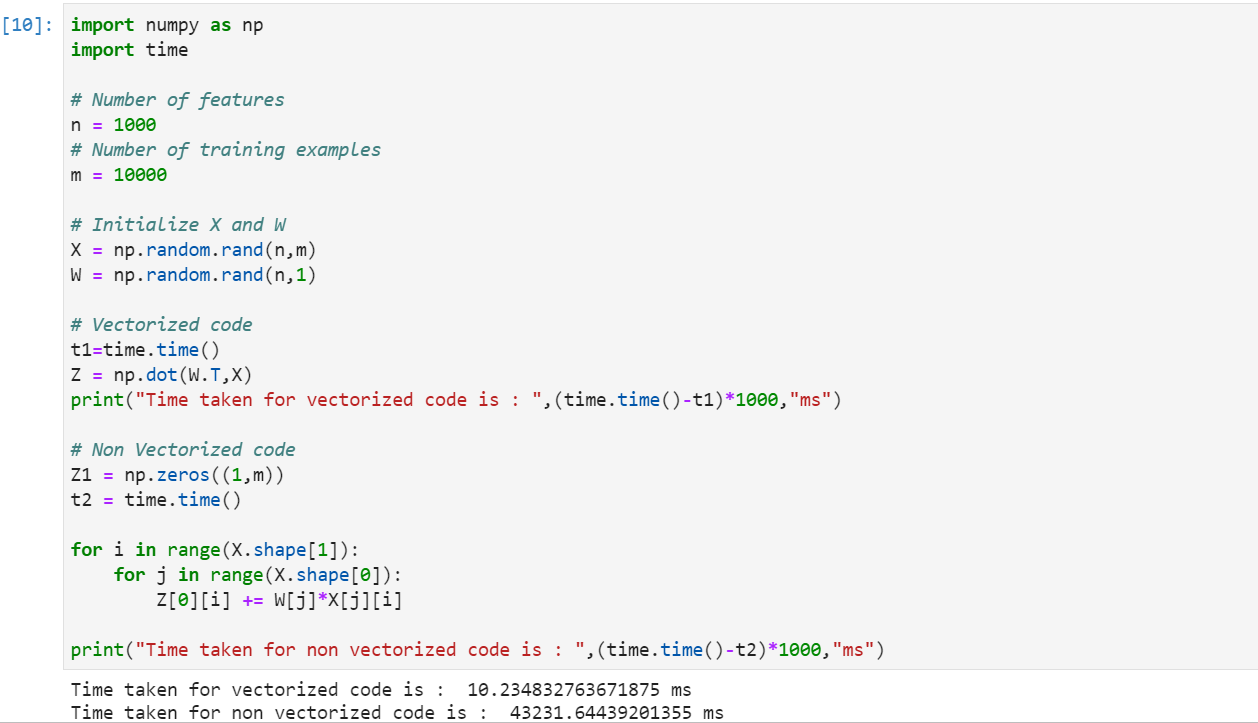
The above implementation considers only 10k training examples and 1k features.
Clearly the vectorized implementation is much faster than the non vectorized one. Numpy is a python library that is used for scientific computation.
It offers various inbuilt functions that make it easy for us to write a vectorized code.
Next Question comes mind is that, we can do time-it or timer for single function but when we have whole script file from which functions are called then what should be done?
Using cProfile to Identify the Bottlenecks
So when we have big script file having lots of functions we can use a tool called cProfile that helps you profile your code and get running times for various elements in your code. In order to use cProfile, put your code inside a python script and run the following command from the terminal.
python -m cProfile -o loops.log mycode_loop.py
Here, -o flag denotes the name of the log file that will be created. In our case, this file is named as loops.log. In order to read this file, we will be needing another utility called cProfileV which can be installed with pip.
pip install cprofilev
Once you have installed it, we can use it to view our log file
cprofilev -f loops.log
[cProfileV]: cProfile output available at http://127.0.0.1:4000
Go to the address in the browser. You will see something like this.
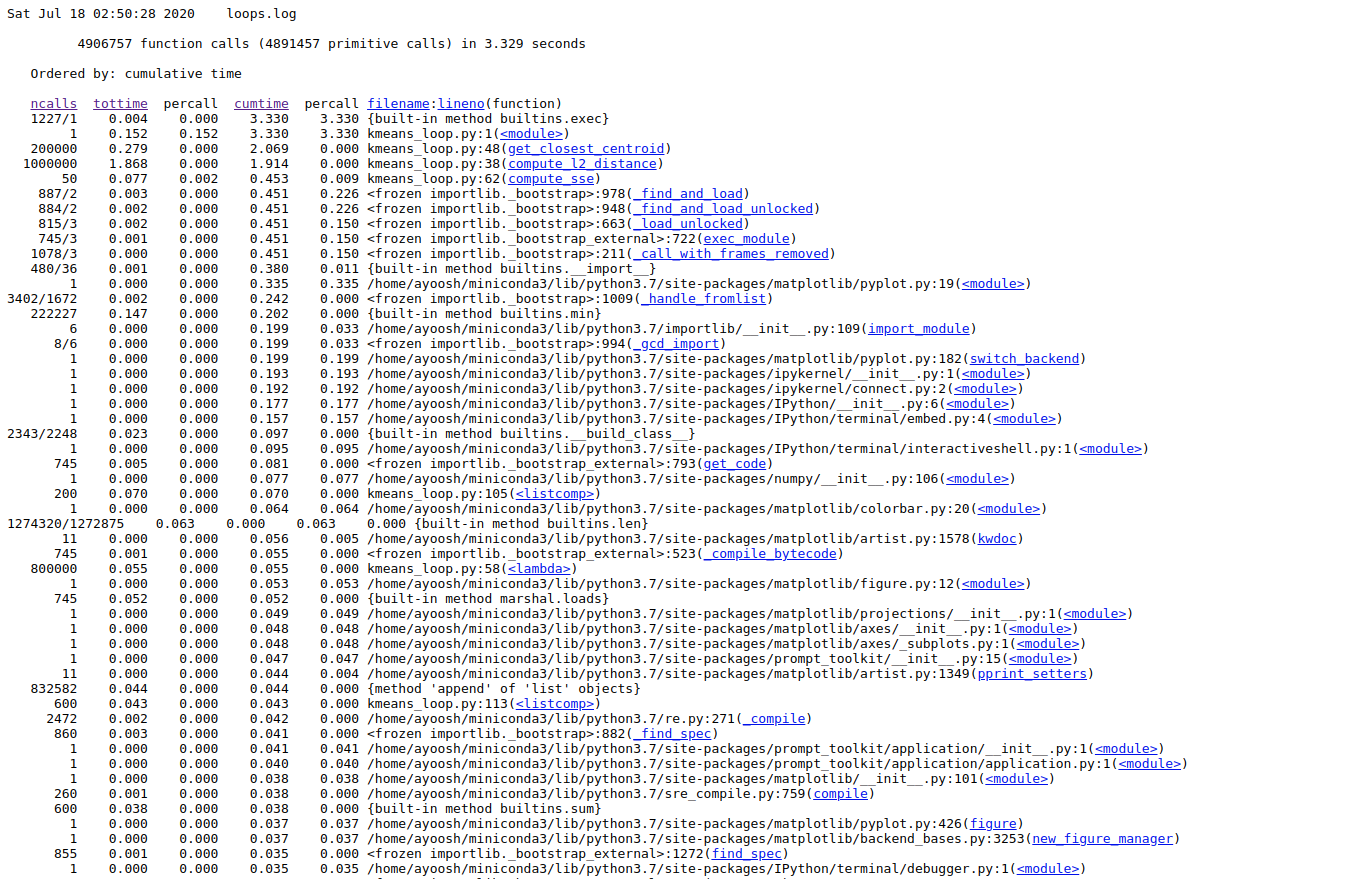
Here, you see column heading on the top regarding each function call in your code.
ncalls: Number of function calls made.tottime: Total time spent in a function alonepercall: Time taken per call.cumtime: Total time spent in the function plus all functions that this function called.filename/lineno: File name and Line number of the function call.
Here, we are most interesting in the time a function call takes by itself, i.e. tottime. We click on the column label to sort the entries by tottime

Once, we have done that we see exactly which functions are taking the most time.
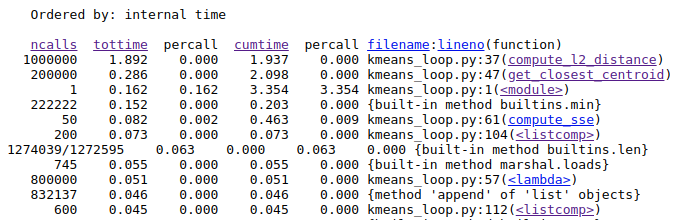
Here, we see that that the function compute_l2_distance and get_closest_centroid take the maximum individual times. Notice that both of these function include loops which can be vectorized. The compute_l2_distance is called 1 million times, while get_closest_centroid is called 200,000 times.
So there is an opportunity to improve the performance using vectorization.
Broadcasting
Question: What broadcasting is all about, example demonstrating its applications?
-
Under some constraints, the smaller matrix is broadcasted to the bigger matrix so that they have compatible dimensions to carry out various mathematical operations. There are few rules that must be followed for Broadcasting in numpy
- Both array must have equal size or
- One of them is 1
if these conditions are not met a ValueError: operands could not be broadcast together exception is thrown, indicating that the arrays have incompatible shapes.
Below is code examples of Numpy broadcasting
>>code:
import numpy as np
x = np.arange(4)
xx = x.reshape(4,1)
y = np.ones(5)
z = np.ones((3,4))

print("Shape of x",x.shape)
print("Shape of Y",y.shape)
print("Shape of xx",xx.shape)
print("Shape of z",z.shape)

>>result:
Shape of x (4,)
Shape of y (5,)
Shape of xx (4, 1)
Shape of z (3, 4)

# add x and y
>>code: x+y

>>result: ValueError: operands could not be broadcast together with shapes (4,) (5,)

# add xx and y
>>code: xx+y
>>result:
array([[1., 1., 1., 1., 1.],
       [2., 2., 2., 2., 2.],
       [3., 3., 3., 3., 3.],
       [4., 4., 4., 4., 4.]])

>>code: (xx+y).shape
>>result: (4, 5)

# add x and z
>>code: x+z
>>result:
array([[1., 2., 3., 4.],
       [1., 2., 3., 4.],
       [1., 2., 3., 4.]])
>>code: (x+z).shape
>>result: (3, 4)
Examples of application:
- Gradient descent utilizes broadcasting
- Adding colors to image matrix
References:
https://pythonspeed.com/articles/minimizing-copying/
https://blog.paperspace.com/numpy-optimization-vectorization-and-broadcasting/
https://blog.paperspace.com/speed-up-kmeans-numpy-vectorization-broadcasting-profiling/